Amazon Brand Analytics gives brand owners in Brand Registry Amazon's own search, purchase, and customer data at no extra cost. Amazon's October 2026 guide features seven reports, from Search Query Performance to Customer Loyalty Analytics. Use the search reports to find where shoppers drop off, and the customer reports to plan bundles and retention.
Amazon's Brand Analytics guide, updated October 2026, features seven dashboards. It is easy to stop at Top Search Terms, export a keyword list, and never open the reports that show where a listing loses the sale. Psychologists call that the streetlight effect: looking where the light is best, not where the answer is. Here is what each report shows and the decision it should drive.
Who can use Amazon Brand Analytics?
Amazon Brand Analytics requires a Professional selling account and the Brand Representative role for a brand enrolled in Amazon Brand Registry. There is no separate fee, though the Professional plan costs $39.99 a month plus selling fees. A brand Administrator can assign the role to additional selling accounts.
In Seller Central, hover over Brands and select Brand Analytics. Search dashboards sit under Search Analytics, and buyer reports sit under Customer Behavior Analytics. Amazon says history usually spans three years and data generally arrives within three days, with quarter-end data taking about a week (Verified November 2026). Not enrolled yet? Our Brand Registry team can help.
 Figure 1: How to open Brand Analytics and what you need first.
The seven Amazon Brand Analytics reports
Amazon's October 2026 guide features seven reports: three search reports, three customer behavior reports, and Customer Loyalty Analytics. Amazon's Brand Analytics overview also mentions Customer Journey Analytics, so treat these seven as the core set, not every view in Seller Central.
| Report | What it tells you | Next action |
|---|---|---|
| Search Query Performance | Queries that reach your brand; impressions, clicks, cart adds, purchases, and your share of each | Find the funnel stage to investigate |
| Search Catalog Performance | The same search funnel, organized by ASIN | Prioritize products for listing work |
| Top Search Terms | Search frequency rank and the three most clicked products per term | Find relevant terms and assess competitors |
| Market Basket Analysis | Products often bought with yours | Evaluate bundles and cross sells |
| Repeat Purchase Behavior | Repeat customers, units, sales, and repeat rate | Find products with retention potential |
| Demographics | Aggregated buyer characteristics (US only) | Check creative and audience assumptions |
| Customer Loyalty Analytics | Loyalty segments and how they change | Plan engagement by segment |
Search Query Performance: where are shoppers dropping off?
Amazon Search Query Performance (SQP) shows the queries that lead shoppers to your brand, with search query volume, search query score, and your brand's share of impressions, clicks, cart adds, and purchases. Brand View covers the whole brand, and ASIN View covers single products.
Read the shares left to right and investigate the first stage where your share falls. A query with 10% impression share but 4% click share is a reason to inspect the search result: image, title, price, and rating. It doesn't prove which one caused the gap, since placement, competitors, and offers also play a part.
| Pattern | Check first |
|---|---|
| Low impression share on relevant queries | Indexing and relevance: keyword research and backend keywords |
| Click share trails impression share | Main image, title, price, ratings, placement |
| Cart add share trails click share | Detail page, variations, offer, reviews, A+ Content |
| Purchase share trails cart add share | Stock, final price, delivery promise |
Treat these as prompts to investigate, not verdicts. If clicks hold up but purchases don't, the issue often sits on the listing, not in the ad account.
 Figure 2: Reading brand share across the SQP funnel. Illustrative sample data.
Search Catalog Performance vs Top Search Terms
Search Catalog Performance organizes the search funnel by ASIN: impressions, clicks, click rate, median price, cart adds, purchases, and conversion rate. Sort products by the biggest funnel losses, then open the detail pages before deciding what to fix.
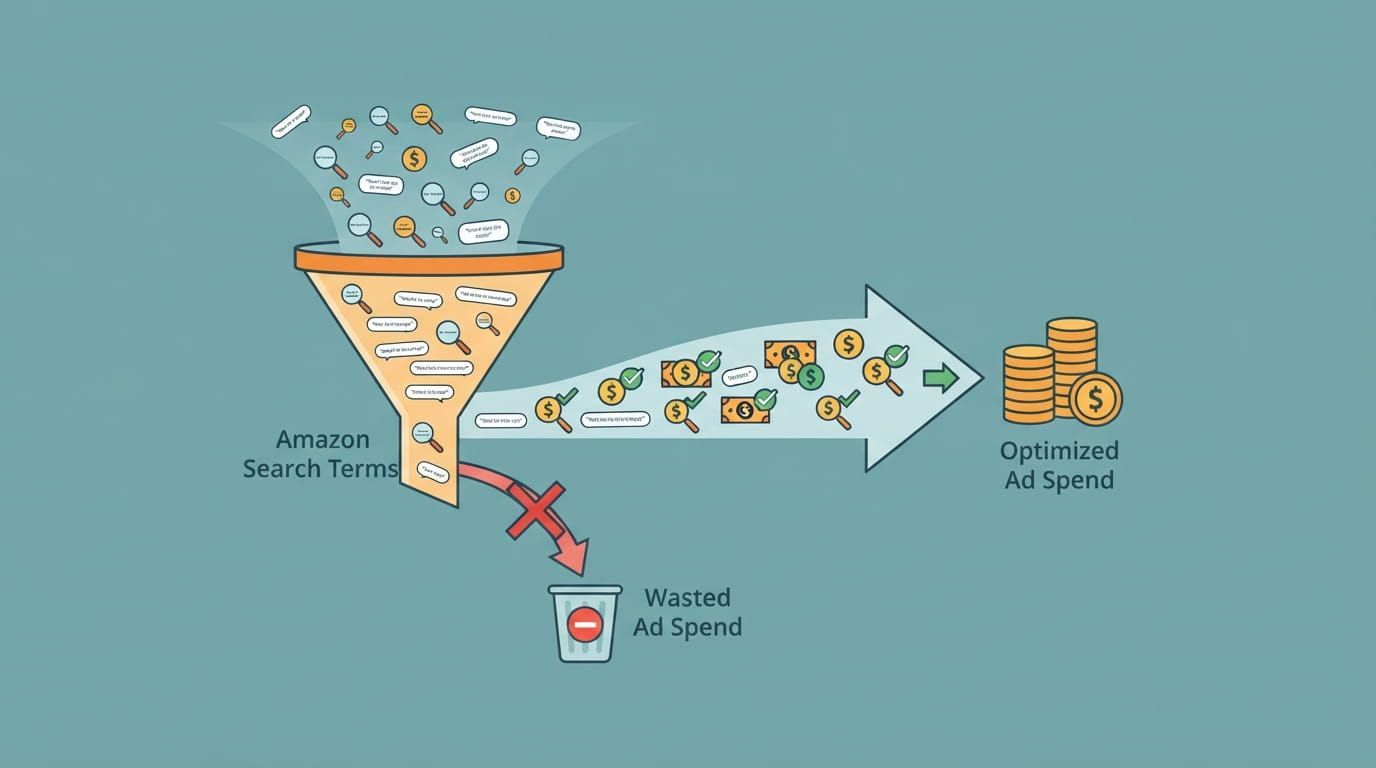
Top Search Terms looks outward. It ranks searches across the store by search frequency rank and shows the three most clicked products per term, with click and conversion share. Search frequency rank is a ranking, not a search volume count. Use it to find relevant terms and see who owns them.
A useful sequence: find a term in Top Search Terms, check your visibility in SQP, then evaluate the affected ASIN in Search Catalog Performance. Relevance comes first, so skip popular terms that don't describe your product.
Customer reports: bundles, retention, and audience
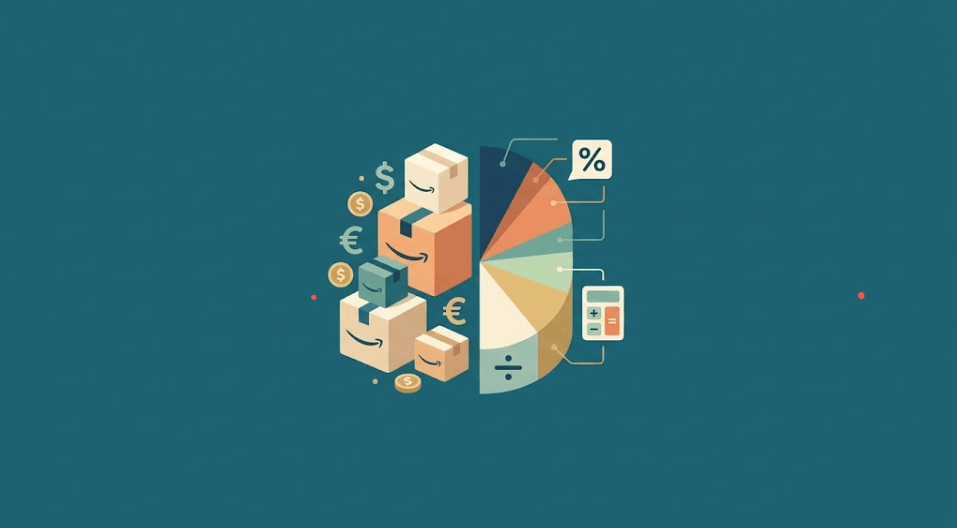
Market Basket Analysis lists the three products customers most often buy with yours, with other brands included or excluded. A complementary product can suggest a virtual bundle, once you check margins and demand.
Repeat Purchase Behavior shows repeat customers, units, sales, and repeat rate by brand or ASIN. Put retention effort behind the products people reorder; our guide to repeat purchases covers the levers.
Demographics shows aggregated age, income, education, gender, and marital status for the US store only. An ASIN needs at least 100 unique customers in the selected period to appear. Treat it as broad context for creative and targeting.
Customer Loyalty Analytics sorts buyers into Top Tier, Promising, At Risk, and Hibernating segments, with suggested ways to engage each.
A weekly Brand Analytics workflow
Work the reports in a fixed order so each one answers the next question.
- Find demand: review relevant terms and competitors in Top Search Terms.
- Locate the gap: in SQP, pick queries with enough volume and a clear drop between stages.
- Choose an ASIN: check it in Search Catalog Performance, then inspect its page, price, stock, and reviews.
- Record a baseline: save the last four comparable weeks of impressions, clicks, cart adds, purchases, and conversion rate, with the query, ASIN, and planned change.
- Make one change: compare the same metrics over a matching period, and note promotions, stockouts, seasonality, or ad changes that could explain the result. Where eligible, Manage Your Experiments gives a cleaner test.
- Review monthly: use the customer reports for bundle and retention planning.
FROM THE CMO DESK
Across 16 years and more than 100 brands, one lesson holds: Brand Analytics shows where the funnel breaks, not why. The why lives on the listing, in the price, or in the competition. Turning that into weekly keyword and listing work is the core of our Amazon SEO services.
What Brand Analytics cannot tell you
The reports are aggregated. They show patterns, not individual motives, and SQP compares your shares with query totals, not each competitor's full funnel. Brand Analytics also doesn't replace Amazon Ads reporting: use the ads search term report for spend, attributed sales, and ACoS.
For Amazon seller analytics beyond your own brand, third party tools estimate market volume and competitor sales. Amazon's own FAQ suggests pairing Brand Analytics with apps such as Helium 10 and Jungle Scout: Brand Analytics for your brand, outside tools for markets you don't sell in yet.
Turn your reports into action
If SQP points to missed clicks or purchases, CMO's Amazon SEO services include a keyword indexation audit and listing optimization built on this data.
Amazon Brand Analytics: Quick Answers Before You Log In
Is Amazon Brand Analytics free?
There is no separate fee. You need a Professional selling plan and the Brand Representative role for a brand in Brand Registry, which is free to join.
Where do I find Brand Analytics?
In Seller Central, go to Brands, then Brand Analytics. If it's missing, ask your brand's Administrator to check your role.
Which report should I open first?
Start with Search Query Performance if your concern is visibility or conversion for existing products. Use Top Search Terms to research broader keyword demand and competitors.
What KPIs does Amazon use in Brand Analytics?
Impressions, clicks, click rate, cart adds, purchases, and conversion rate, plus your brand's share of each in SQP. Account health metrics live separately in Seller Central; see our account health guide.
How often is the data updated?
Amazon says data generally arrives within three days, with quarter-end data typically available within a week. Availability varies by report and selected period.