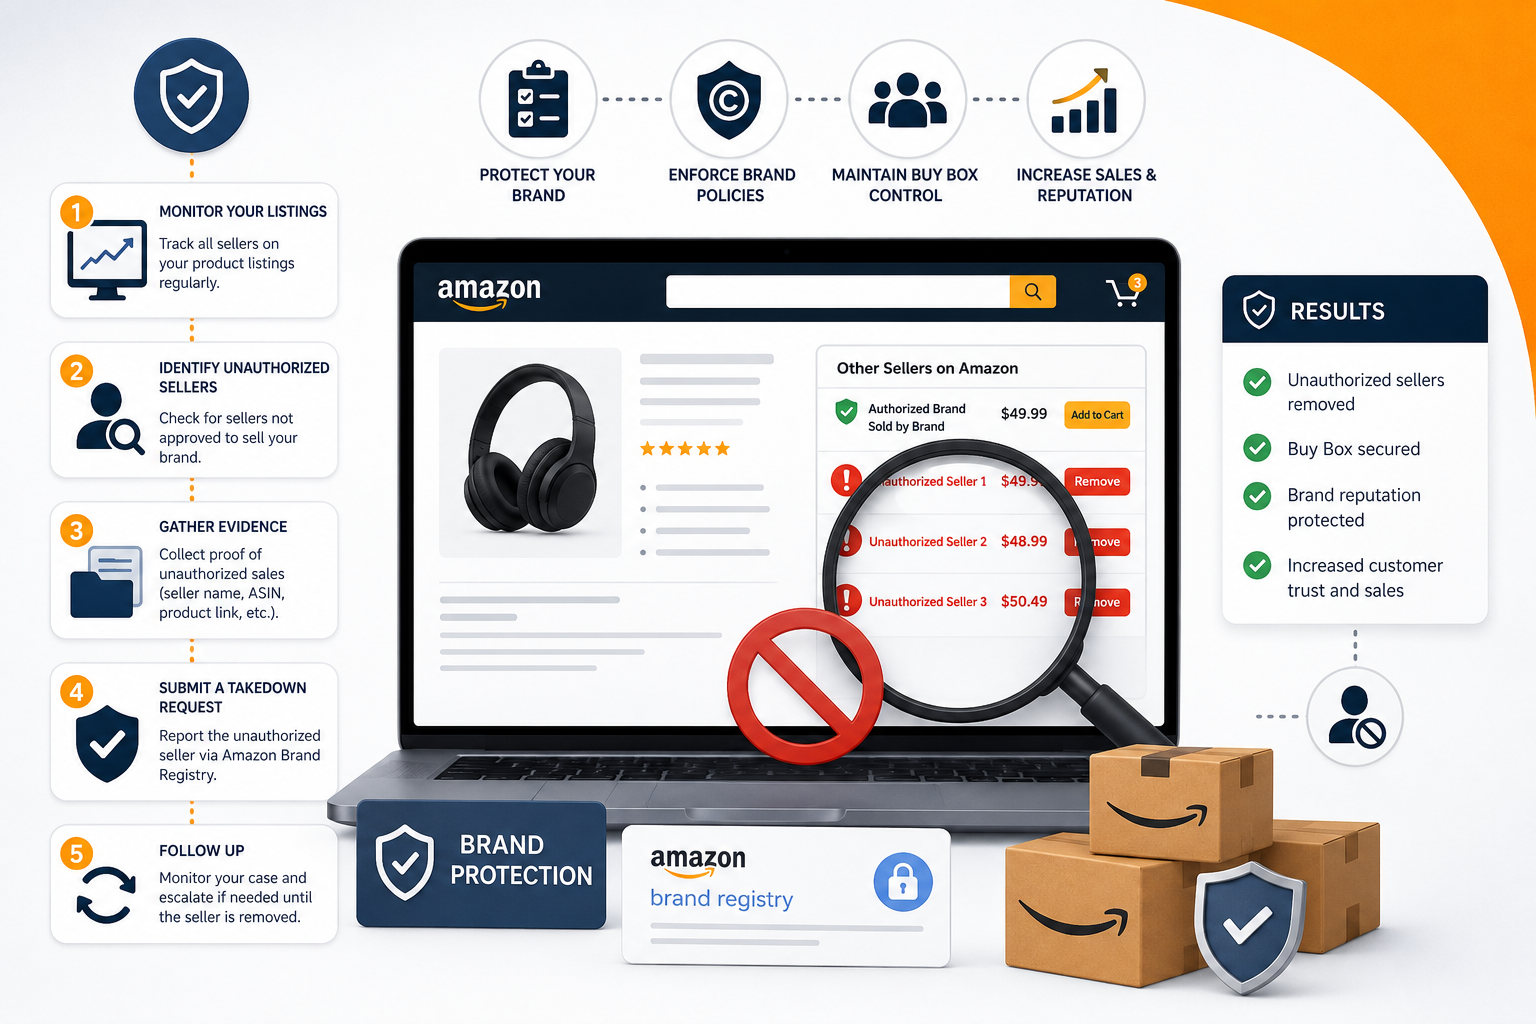
A/B Testing on Amazon: The Tests That Actually Move Revenue

William Fikhman • December 1, 2025

Share this article

INTRODUCTION — WHY MOST AMAZON BRANDS RUN TESTS THAT DON’T MATTER

Amazon brands love the idea of A/B testing.

It feels scientific.
It feels strategic.
It feels like you’re being data-driven.
It feels like you’re finally taking control of your listing performance.

So what happens?

Teams start testing:

  • Bullet variations

  • Title phrasing

  • Description edits

  • Keyword order

  • Minor copy tweaks

  • Brand tone adjustments

  • Line breaks, commas, phrasing, and structure

And after weeks of testing?

Revenue doesn’t move.
Conversion doesn’t move.
CTR stays the same.
PPC still bleeds.
Ranking refuses to shift.

Everyone looks around confused.

“Why isn’t the test helping?”
“We changed something — why don’t we see a difference?”
“Is the experiment broken?”
“Is Amazon suppressing the change?”
“Do we need new bullets again?”
“Should we test longer?”

This is where most brands get stuck.

They’re   testing , but they’re testing the wrong things.

They’re running experiments on parts of the listing that have minimal influence on revenue-driving behavior.

And the parts that   do influence revenue?
They’re not testing those at all.

This is the foundational flaw in how most Amazon brands run experiments — they optimize the wrong assets.

This blog cuts through the noise.
It reveals exactly which A/B tests actually move revenue, why they work, how to run them properly, and how to avoid the massive time-waste that 90% of brands fall into.

Let’s get deep.


CHAPTER 1 — UNDERSTANDING WHAT A/B TESTING REALLY MEASURES ON AMAZON

Before we get into which tests matter, we need one crucial mindset shift:

A/B testing is not about “improving the listing.”
It’s about improving customer behavior.

The only behavior Amazon cares about — and the only behavior A/B testing truly affects — is:

  • CTR (Click-Through Rate)

  • CVR (Conversion Rate)

  • Add-to-Cart Rate

  • Purchase Completion Rate

  • On-Page Time

  • Bounce Rate

These behaviors directly influence:

  • Organic rank

  • PPC cost

  • Profitability

  • Review velocity

  • Brand visibility

  • Growth trajectory

But here’s the important part:

Not all listing elements influence customer behavior equally.

Some have an enormous impact.
Some have moderate impact.
Some have almost no impact at all — even if they feel important.

Understanding which is the foundation of meaningful A/B testing.


CHAPTER 2 — THE LISTING ELEMENTS WITH THE HIGHEST IMPACT

If the goal is to increase revenue, then the goal is to influence the behavior that leads to revenue.

Here are the elements that move revenue the most:

1. Main Image —   Highest impact on CTR

The main image determines:

  • Whether customers click your listing

  • Whether your ads get cheap or expensive traffic

  • Whether your organic rank improves or drops

  • Whether shoppers stop scrolling

2. Price —   Highest direct impact on CVR

Small price adjustments often cause massive swings in CVR.

3. Image Stack (Images #2–#7) —   High impact on CVR and Bounce Rate

These images determine:

  • Whether the shopper understands the product

  • Whether the shopper trusts the brand

  • Whether the product fits their needs

  • Whether they continue scrolling

  • Whether they add to cart

4. A+ Content —   Moderate to high impact on CVR

A+ reinforces key benefits and reduces buyer friction.

5. Title —   Moderate impact on CTR + indexing

Strong titles influence relevance and click-through.

When you rank these by actual impact, the hierarchy becomes clear:

Main Image → Price → Image Stack → A+ Content → Title → Bullets → Description → Backend Keywords

But most brands test in the opposite order:
They start with bullets — the
  lowest impact asset.

This is why testing feels pointless.

You’re testing the wrong things.


CHAPTER 3 — THE TESTS MOST BRANDS RUN THAT MOVE NOTHING

These are the tests that waste time and rarely increase revenue:

❌ Bullet rewrites

Buyers rarely read bullets unless they’re already convinced.

❌ Minor title phrasing changes

Changing “Premium Stainless Steel” to “High-Grade Stainless Steel” rarely influences CTR.

❌ Description rewrites

Description sits too low on the page to change CVR significantly.

❌ Tiny copy edits

Commas vs. dashes vs. separators don’t change behavior.

❌ Keyword rearrangements

SEO relevance rarely shifts enough to impact revenue.

❌ A/B testing packaging graphics (in images)

Unless packaging is the differentiator, it rarely impacts decisions.

❌ Rearranging bullet order

Buyers skim — order rarely sways them.

These tests feel important but rarely matter.

You might get a +1% improvement, but you won’t get the +10–30% conversion lift that real revenue-impacting tests deliver.


CHAPTER 4 — THE TESTS THAT   ACTUALLY MOVE REVENUE

Here we break down the tests with the highest impact — and why they work.


TEST 1 — MAIN IMAGE TRANSFORMATION

Impact: Extremely High (CTR + Ranking + PPC Cost)

Changing the main image is the single most powerful A/B test on Amazon.
Why?

Because it influences the first — and most critical — shopper behavior:

Click or scroll.

If they don’t click → no sale.
If they do click → everything else becomes possible.

Even small changes to the main image can produce massive lifts:

  • Angle changes

  • Lighting improvements

  • Better cropping

  • Removal of dead space

  • Cleaner contrast

  • More vibrant product rendering

  • Adding packaging (if compliant)

  • Including size props

  • Switching to a 3D render

  • Showing accessories

  • Zooming in more intelligently

A great main image test can increase CTR by:

10% – 50%+

That improvement alone can:

  • Lower CPC

  • Improve ad efficiency

  • Boost ranking

  • Increase organic traffic

  • Lower TACoS

  • Increase revenue

If you only run one test — it should be this one.


TEST 2 — PRICE ELASTICITY TESTS

Impact: Extremely High (CVR + Revenue Per Session)

Most brands avoid price testing out of fear.

“What if we lose sales?”
“What if customers stop buying?”
“What if we ruin our ranking?”

But price tests are incredibly powerful.

Small adjustments — even $1 to $3 — can:

  • Increase conversion

  • Improve perceived value

  • Reduce buyer friction

  • Increase total revenue

  • Improve session value

  • Shift your product into a more competitive zone

Example outcomes:

  • Increasing price → fewer units but more profit

  • Decreasing price → more units, more total revenue, better ranking

  • Finding the “sweet spot” price → maximum revenue per session

Price tests are uncomfortable but essential.


TEST 3 — FULL IMAGE STACK REDESIGN

Impact: High (CVR)

Your images are your real salesperson — not your bullets.

A strong image stack:

  • Builds trust

  • Shows benefits

  • Clarifies features

  • Answers objections

  • Educates the shopper

  • Creates desire

  • Reduces confusion

Testing new images — especially the first 3–4 — is a major CVR booster.

Key image elements to test:

  • Benefit-order placement

  • Infographic clarity

  • How-to steps

  • Lifestyle context

  • Product sizing images

  • Comparison charts

  • Social proof badges

  • Icons vs. text layouts

  • Color schemes and typography

A powerful image stack test can increase CVR by:

5–30%


TEST 4 — A+ CONTENT REDESIGN

Impact: Moderate to High (CVR + Bounce Rate)

A+ matters more than brands realize because:

  • Mobile shoppers scroll A+ quickly

  • It visually completes the “story”

  • It reduces friction and uncertainty

  • It builds trust

  • It boosts retention

When customers scroll through A+, they decide:

“Yes, I’m ready to buy,”
or
“No, I don’t trust this.”

Testing A+ variations can significantly improve the bottom of the funnel.


TEST 5 — TITLE RESTRUCTURING (NOT REWRITING)

Impact: Moderate (CTR + Relevancy)

Title tests matter   only when the structure changes — not when a few words move around.

Testing:

  • Keyword order

  • Clarity

  • Benefit-first vs. spec-first

  • Adding a use-case

  • Adding size or count

  • Adding compatibility

These can shift CTR, especially on mobile.


CHAPTER 5 — HOW TO STRUCTURE A SUCCESSFUL A/B TEST

Running a test is not enough.
Running it correctly is the key.

Here’s the framework used by top-tier Amazon operators:


STEP 1 — Identify the behavior you want to influence

  • CTR → test main image or title

  • CVR → test image stack or price

  • Bounce Rate → test A+ or images

  • Add-to-Cart Rate → test benefits in images

  • Session value → test price

You must know the goal   before making a change.


STEP 2 — Track baselines for at least 14 days

Baseline metrics include:

  • Sessions

  • Session % (conversion)

  • CTR

  • Add-to-cart %

  • Buy box %

  • Review impact

  • PPC spend

  • TACoS

  • Organic rank

  • Impression volumes

Without a baseline, you can’t interpret the results accurately.


STEP 3 — Test ONE THING at a time

If you change:

  • Images

  • A+

  • Bullets

  • Title

…all in the same week, you have NO IDEA what caused the result.

Mini rule:

One variable = one test.


STEP 4 — Let your test run for 14–28 days

Short tests are misleading because:

  • Amazon normalizes traffic

  • Competitors fluctuate

  • PPC auction dynamics shift

  • Weekends behave differently from weekdays

You need time.


STEP 5 — Evaluate with cold data, not emotion

Ask:

  • Did CTR increase?

  • Did CVR increase?

  • Did PPC efficiency improve?

  • Did the session value increase?

  • Did ACoS/TACoS drop?

  • Did organic rank improve?

If the numbers say yes — keep it.
If the numbers say no — revert.


CHAPTER 6 — HOW TO AVOID THE BIGGEST TESTING MISTAKES

Most brands waste testing opportunities because they fall into one of these traps:


Mistake 1 — Testing bullets first

Bullets rarely move revenue in any meaningful way.
They are low-impact.


Mistake 2 — Testing too many variables at once

This creates confusion and useless data.


Mistake 3 — Running tests too short

Amazon needs time to normalize.


Mistake 4 — Letting emotions influence decisions

Great data doesn’t always look pretty.
Pretty images don’t always perform better.


Mistake 5 — Ignoring mobile behavior

Mobile shoppers rule Amazon.
Test your visuals with mobile screenshots, not desktop previews.


Mistake 6 — Not testing price

It is the easiest lever for improving conversion — yet the most ignored.


CHAPTER 7 — HOW A/B TESTING DIRECTLY INCREASES REVENUE

Let’s make this simple.

Every test that improves CTR or CVR increases revenue.

If CTR increases by 20%…

→ more people enter your listing
→ more conversions
→ more ranking
→ cheaper ads
→ more organic traffic
→ more revenue

If CVR increases by 10%…

→ more buyers
→ stronger ranking
→ better return on ads
→ higher session value
→ more profitability
→ brand grows faster

This is why testing matters — when you test the right things.


CHAPTER 8 — THE REVENUE-DRIVING TESTING BLUEPRINT

Here is the exact order top-performing brands use:


PHASE 1 — Fix traffic

  • Main image test

  • Title structure test

PHASE 2 — Fix conversion

  • Price test

  • Image stack overhaul

  • A+ redesign

PHASE 3 — Fix retention

  • Lifestyle image tests

  • Social proof placement tests

PHASE 4 — Expand

  • New variations

  • Store testing

  • Sponsored Brand creative testing

This blueprint reliably increases revenue — often dramatically.


CHAPTER 9 — A/B TESTING DONE RIGHT BECOMES A COMPETITIVE ADVANTAGE

Most brands see A/B testing as optional.

Top brands see it as a revenue engine.

When executed correctly, testing becomes:

  • A ranking advantage

  • A conversion advantage

  • An advertising advantage

  • A competitive advantage

  • A long-term moat

Most brands are testing the wrong things.
If you test the right ones — consistently — you win.


CONCLUSION — A/B TESTING IS ONLY POWERFUL WHEN YOU TEST WHAT MATTERS

If you remember only one thing from this entire blog, it should be this:

A/B testing should focus on the elements that influence shopper behavior the most.

That means:

  • Main image

  • Price

  • Image stack

  • A+

  • Title structure

NOT:

  • Bullet formatting

  • Description edits

  • Keyword reshuffling

  • Tiny copy changes

The tests that actually move revenue are bold.
They’re visual.
They’re behavioral.
They’re meaningful.

 When you test the right levers, Amazon becomes predictable.
Conversion improves.
Ranking improves.
Advertising becomes cheaper.
Revenue grows.
Profit grows.
The entire flywheel starts spinning faster.

 A/B testing is not about tweaking.
It’s about transforming.


Smiling bearded man in a light patterned shirt against a gray background


William Fikhman is the founder of Chief Marketplace Officer (CMO), a fractional Amazon executive agency based in Los Angeles, California. He began selling on Amazon in 2009, scaling to $5M in year one and $20M+ within two years. Over 16 years, William has managed Amazon operations for more than 100 consumer brands, overseeing $300M+ in marketplace revenue across Seller Central and Vendor Central. He founded CMO to give consumer brands access to senior-level Amazon leadership on a fractional basis — without the cost of a full-time hire or the limitations of a traditional agency. William specializes in brand protection, distribution control, Amazon PPC strategy, and marketplace operations.
Connect on LinkedIn | Book a consultation


Recent Posts

By William Fikhman June 10, 2026
Amazon's ranking systems evolved beyond keyword matching. Here is what changed, what behavioral signals now drive visibility, and how modern Amazon SEO works.
th:first-child, td:first-child
By William Fikhman June 2, 2026
Amazon backend keywords are the hidden search terms that expand your indexation. Here is the 250-byte limit, what to include, what to exclude, and how to fill it correctly.
Stylized Amazon logo with rockets, charts, and glowing arrows on a blue tech background
By William Fikhman May 25, 2026
Learn the Amazon product launch strategy that works in 2026. Improve conversion, reviews, PPC performance, and scale profitably.
E-commerce workflow illustration with product screens, shopping cart, and package delivery icons on a blue background
By William Fikhman May 25, 2026
Learn why Amazon image stacks drive higher conversions than keywords and how optimized product images improve clicks, trust, rankings, and sales.
Global logistics scene with drones, trucks, workers, and a rising blue arrow around a globe
By William Fikhman May 20, 2026
Discover how Amazon Supply Chain Services (ASCS) helps businesses scale faster with advanced logistics, fulfillment, and delivery solutions.
Upward growth chart with people climbing a rising arrow toward a rocket launch, symbolizing success
By William Fikhman May 18, 2026
Here’s a **160-character SEO meta description**: Data-driven Amazon listing optimization in 2026 helps sellers improve rankings, boost conversions, and outperform competitors using advanced tools and strategy.
Image Showing  pu
By William Fikhman May 6, 2026
Unlock Amazon Subscribe & Save in 2026: turn one-time buyers into recurring revenue, boost retention, and grow predictable sales for CPG and consumable brands.
Boxes Showing Amazon Vine vs. Early Reviewer Program
By William Fikhman May 6, 2026
Amazon Vine vs Early Reviewer Program: see which builds social proof faster in 2026 and how Vine drives reviews, rankings, and conversions.
Amazon Advertising logo on dark gray background with orange curved arrows around the text
By William Fikhman April 7, 2026
An Amazon growth agency manages the operational, advertising, and compliance systems that break when founders try to scale alone. Here is what that actually means.
Amazon Rufus logo with a smiling yellow dog on a blue background
By William Fikhman April 7, 2026
In the 2026 Amazon marketplace, product discovery has shifted from traditional keyword search to AI-powered conversations and visual inputs. As the CEO of an Amazon services agency, I’ve seen brand owners struggle as shoppers increasingly rely on Rufus to ask natural questions, upload photos, or get instant recommendations. We are no longer only competing against other listings; we are competing against Amazon’s multimodal AI that “sees” your images, understands context, and decides whether your product deserves to surface.  This is the Rufus-Ready Image Blueprint: Your visuals must now serve dual purposes — instantly convincing human shoppers while providing clear, machine-readable signals that help Rufus confidently match your product to buyer intent. If your images fail to deliver both, even strong keywords and PPC won’t save the listing. The New Discovery Reality: AI That Sees and Understands By 2026, Rufus has become a dominant force in how shoppers explore Amazon. It handles conversational queries, processes uploaded photos via visual search, identifies materials, styles, proportions, and real-world use cases, then surfaces relevant products or alternatives. When a shopper interacts with Rufus — whether typing “show me a blender that crushes ice easily” or uploading a kitchen photo — the AI scans your product images using computer vision and OCR. Your visuals are no longer just decorative; they are data sources that either strengthen or weaken Rufus’s confidence in recommending your item. To succeed in this environment, brand owners must ensure their image stack meets these core requirements: High-Resolution Clarity: Minimum 1000 pixels on the longest side (ideally 2000x2000+), with sharp focus that enables zoom and detailed inspection. Rufus extracts features like texture, dimensions, and functionality from clear images. Contextual Storytelling: Show the product in authentic lifestyle scenarios tied to buyer needs rather than sterile white-background shots alone. This helps Rufus map your item to specific use cases and emotional triggers. Fast and Mobile-Optimized: Compress images properly for quick loading on mobile devices while preserving quality, since most Rufus interactions happen on phones. Many brand owners we work with discover that weak visuals cause Rufus to overlook their products even when text matches the query. Building Trust Through AI-Friendly Visual Storytelling In an era flooded with AI-generated content, authenticity combined with strategic visuals creates your strongest competitive moat. Shoppers and Rufus alike make rapid judgments. Generic or low-effort images signal unreliability, causing quick bounces and poor algorithmic signals. To multiply trust and feed Rufus meaningful data, we recommend structuring your full image stack (up to seven main images plus A+ modules) with intention: Detail-Oriented Shots: Include multiple angles, close-ups of key features (e.g., materials, mechanisms, size comparisons), and infographics that visually call out specifications. Add descriptive alt text in A+ Content such as “Woman using high-speed blender with tamper to crush ice for green smoothie” to give Rufus extra context. Lifestyle Integration: Demonstrate real-world application across different scenarios relevant to your audience. For example, show the product solving specific problems or fitting into daily routines. This builds emotional connection for humans and contextual understanding for AI. Consistent Brand Identity: Maintain uniform lighting, color palette, composition, and style across all images. Inconsistency confuses both shoppers and Rufus when it tries to build a coherent product narrative. Our agency audits and redesigns image stacks for clients, often resulting in higher click-through rates, longer dwell time, and improved Rufus-driven visibility. Optimizing Visuals to Strengthen Algorithm Signals Amazon’s underlying A9/A10 system, enhanced by multimodal AI like Rufus and COSMO, now weighs image quality and relevance alongside text. Strong visuals reinforce claims, improve conversion rates, and send positive performance signals back to the algorithm. Here are actionable steps we implement for brand owners: Leverage A+ Content Fully: Use rich modules with comparison charts, infographics, short videos, and interactive elements (where available via Brand Registry). Well-executed A+ Content can lift conversions by 10-20% or more while giving Rufus additional data points about benefits and differentiators. Feature Visualization: Overlay clear, benefit-focused text on images (e.g., “Fits most 15-inch laptops” or “Waterproof up to 1 meter”) instead of generic labels. This helps both human scanning and AI parsing. Friction Reduction: Answer common objections visually before shoppers ask — size references, usage outcomes, material close-ups. This lowers cart abandonment and improves overall listing performance metrics that influence ranking. Avoiding the 2026 Visual Optimization Pitfalls Even solid PPC or keyword strategies can be undermined by visual mistakes that hurt both human conversion and AI understanding. In today’s environment, these issues are especially expensive: Overly Busy or Cluttered Images: Too much text, logos, or competing elements overwhelm mobile viewers and confuse computer vision systems. Keep compositions clean and focused on one primary message per image. Edge and Cropping Problems: Important details placed near frame borders often get cut off on different device ratios. Design with generous safe zones. Lack of Differentiation: If images blend in with category competitors, Rufus and shoppers treat your product as a commodity. Use unique lifestyle contexts and clear USPs to stand out without exaggeration. Ignoring Alt Text and Metadata: Failing to add descriptive, context-rich alt text in A+ modules misses an easy opportunity to feed Rufus better signals. We run regular competitive visual audits to help brands sidestep these traps and turn average listings into high-performing assets. Conclusion: Visuals Are Now Core to Discovery and Conversion As we advance through 2026, the boundary between search optimization, visual content, and AI-driven discovery has largely disappeared. Your images function as critical inputs for Rufus, the broader algorithm, and human buyers alike. A well-crafted visual blueprint ensures your brand isn’t merely discovered — it’s confidently recommended and chosen. Mastering Rufus-ready visuals delivers compounding benefits: higher organic visibility, better ad performance, stronger conversions, and reduced reliance on paid traffic over time.
Show More